
Understanding how to read candlestick patterns is essential for anyone looking to make informed trading decisions. These provide visual insights into market sentiment and help traders predict price movements.
Gold Rate
June 04- 2026 - Time 10.30Hrs

To succeed in trading, one must develop the ability to analyse price movements accurately. Many traders focus on technical indicators, but those who learn to trade using candlestick patterns often gain a deeper understanding of market psychology. Recognising the most common ones can help in predicting reversals, trends and breakouts, which leads to smarter investment choices.
What Are Candlestick Patterns
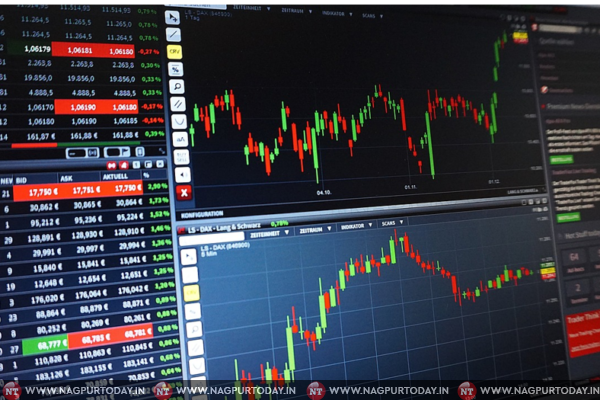
They originated in Japan over 300 years ago and have become a standard tool in modern trading. Each candlestick represents a specific period and shows the opening, closing, high and low prices. The shape and colour indicate whether the market is bullish or bearish.
A green or white one means the closing price was higher than the opening price and indicates buying pressure. A red or black one means the closing price was lower than the opening price, which signals selling pressure. Studying patterns formed by these candlesticks helps traders predict future price movements with greater accuracy.
Common Candlestick Patterns Every Trader Should Know
Bullish Candlestick Patterns
These indicate that buyers are gaining strength and the price is likely to rise. Recognising these patterns early can help traders enter positions at the right time.
- Bullish engulfing: A larger green candlestick completely engulfs the previous red one, which suggests strong buying momentum.
- Hammer: A small body with a long lower wick that shows that sellers tried to push prices down but buyers regained control.
- Morning Star: A three-candlestick pattern that signals the end of a downtrend and the start of a bullish phase.
Bearish Candlestick Patterns
This type indicates that sellers are in control and prices may decline. Recognising these patterns helps traders avoid losses or take short positions.
- Bearish engulfing: A large red candlestick fully engulfs the previous green one, which signals strong selling pressure.
- Shooting Star: A small body with a long upper wick that shows buyers pushed prices up but lost momentum.
- Evening Star: A three-candlestick pattern that indicates a reversal from an uptrend to a downtrend.
How Market Conditions Affect Candlestick Patterns
External factors such as inflation can influence price movements, which makes it important to consider economic data alongside technical analysis. Economic indicators such as GDP growth, interest rates and employment reports impact investor sentiment. A bullish pattern in a strong economy may indicate long-term growth, while the same pattern in a weak economy may suggest only a short-term recovery.
How to Practise Candlestick Trading
Steps to Improve Your Skills
- Use a demo account: Practising with virtual money helps traders understand patterns without financial risk.
- Backtest historical data: Analysing past charts can improve pattern recognition skills.
- Combine with other indicators: RSI or moving averages used alongside candlestick patterns increase accuracy.
- Maintain a trading journal: Keeping track of trades helps identify mistakes and improve strategies.
Comparison of Key Candlestick Patterns
| Pattern Name | Type | Signal | Key Feature |
| Bullish engulfing | Bullish | Uptrend continuation | Large green candle engulfs red candle |
| Bearish engulfing | Bearish | Downtrend continuation | Large red candle engulfs green candle |
| Hammer | Bullish | Reversal from downtrend | Small body with long lower wick |
| Shooting Star | Bearish | Reversal from uptrend | Small body with long upper wick |
| Morning Star | Bullish | Trend reversal | Three-candlestick pattern |
| Evening Star | Bearish | Trend reversal | Three-candlestick pattern |
How to Avoid Common Mistakes
Many traders misinterpret candlestick patterns due to a lack of experience or by ignoring market conditions. Here are some common mistakes and how to avoid them
- Do not ignore market context: Always consider the broader economic situation before relying on a pattern.
- Do not trade too quickly: Wait for confirmation before making a trade based on a single pattern.
- Do not use patterns in isolation: Combine the analysis with other technical tools for better accuracy.
Final Thoughts
Candlestick patterns are a powerful tool for predicting price movements and making smarter decisions. A strong understanding of them can allow traders to improve their market timing and reduce risks. The key to success lies in practice, patience, and continuous learning.
Regardless if you are trading stocks, forex or commodities, mastering candlestick patterns can give you an edge in the market. Recognising trends and reversals early allows for better risk management and improved profitability over time.
https://pixabay.com/photos/chart-trading-courses-forex-1905225/
https://pixabay.com/photos/chart-trading-courses-forex-1905224/