
Nagpur: The countdown to the 2025 Nagpur Municipal Corporation (NMC) elections has officially begun. On Saturday, October 4, NMC released the final ward boundaries for the upcoming civic polls, marking the culmination of a long-drawn and politically sensitive delimitation process.
The final notification was issued at the NMC headquarters in Civil Lines and simultaneously uploaded on the civic body’s official website, www.nmcnagpur.gov.in.
This marks the end of months of deliberations, hearings, and revisions following the release of the draft ward boundaries. During the process, several citizens, political representatives, and civic organizations raised objections about the shifting of localities, population imbalance, and alleged gerrymandering. Officials reviewed these submissions and incorporated necessary corrections before finalizing the boundaries.
Gold Rate
June 19 ,2026 - Time 10.30Hrs

With this, Nagpur’s electoral map is now sealed, defining which neighbourhoods fall under which wards, and thereby shaping the political battlefield for the upcoming civic polls.
Political parties can now begin identifying strongholds, mobilizing cadres, and finalizing candidates as they gear up for elections that have been overdue since March 2022.

The finalization of ward boundaries signifies not only an administrative milestone but also a political turning point, signalling that the city’s long wait for elected local governance is nearing its end.
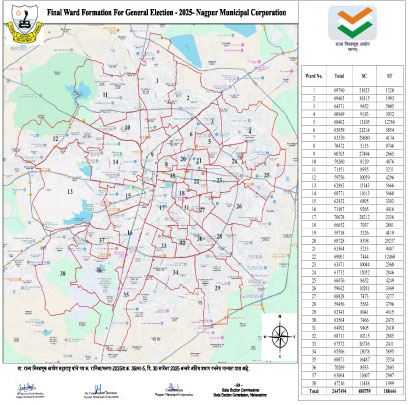
Final Ward Formation for General Election – 2025 (Nagpur Municipal Corporation)

Nagpur’s civic poll battlefield has officially been drawn, and the contest for every ward begins now.
| Ward No. | Total Population | SC Population | ST Population |
| 1 | 69,790 | 21,823 | 1,520 |
| 2 | 69,465 | 36,315 | 1,993 |
| 3 | 64,371 | 9,652 | 5,005 |
| 4 | 60,949 | 9,183 | 3,932 |
| 5 | 68,482 | 13,105 | 12,768 |
| 6 | 63,959 | 21,214 | 3,854 |
| 7 | 63,370 | 29,680 | 4,134 |
| 8 | 70,472 | 5,133 | 9,746 |
| 9 | 60,703 | 27,494 | 2,665 |
| 10 | 59,260 | 8,129 | 4,876 |
| 11 | 71,151 | 8,935 | 3,231 |
| 12 | 59,756 | 10,059 | 4,296 |
| 13 | 62,882 | 15,143 | 5,666 |
| 14 | 60,771 | 11,613 | 5,468 |
| 15 | 62,432 | 6,895 | 3,383 |
| 16 | 71,187 | 9,265 | 4,016 |
| 17 | 70,678 | 28,212 | 2,336 |
| 18 | 66,652 | 7,037 | 2,881 |
| 19 | 59,718 | 3,326 | 4,119 |
| 20 | 68,728 | 8,398 | 29,237 |
| 21 | 63,364 | 5,233 | 9,487 |
| 22 | 69,001 | 7,444 | 12,460 |
| 23 | 63,471 | 10,044 | 2,360 |
| 24 | 61,732 | 12,052 | 2,846 |
| 25 | 66,076 | 8,652 | 4,249 |
| 26 | 59,642 | 10,281 | 3,369 |
| 27 | 66,828 | 7,473 | 3,277 |
| 28 | 59,456 | 5,563 | 3,796 |
| 29 | 62,343 | 8,041 | 4,315 |
| 30 | 63,564 | 7,466 | 2,475 |
| 31 | 64,092 | 9,405 | 2,410 |
| 32 | 68,711 | 10,215 | 2,885 |
| 33 | 67,572 | 26,736 | 2,431 |
| 34 | 65,506 | 13,078 | 5,895 |
| 35 | 60,871 | 16,487 | 3,554 |
| 36 | 70,209 | 8,933 | 2,603 |
| 37 | 63,064 | 11,607 | 2,907 |
| 38 | 47,216 | 11,438 | 1,999 |
| Total | 24,47,494 | 4,80,759 | 1,88,444 |


5 मिनट की चूक... 4.50 लाख पर चोरों का झपट्टा! #nagpurnews #crime...

प्रेम का झांसा, ब्लैकमेलिंग और वसूली का खेल! #nagpurnews #crime #latestnews #maharashtranews

खाकी का रौब, ठगी का खेल! फर्जी पुलिस का किया पर्दाफाश #nagpurnews...

मध्य प्रदेश से नागपुर तक गांजे की डिलीवरी! #nagpurnews #crime #md #taskar...

फर्जी दस्तावेजों के दम पर 15 लाख की ठगी.. #nagpurnews #crime #goldloan...

सुसाइड नोट में लिखा "सॉरी मां, मुझसे नहीं हो पाया" #nagpurnews #suciedad...